前言
最近公司项目都偏向于数字化大屏展示🥱,而这次发给我的项目原型中出现了一个金字塔图🤔️, 好巧不巧,由于我们的图表都是使用Echarts,而Echarts中又不支持金字塔图,作为一个喜欢造轮子的前端开发,虽然自身技术不咋滴,但喜欢攻克难题的精神还是有的😁, 不断地内卷,才是我们这些普通前端开发的核心竞争力😂,所以就有了仿Echarts实现金字塔图的想法。
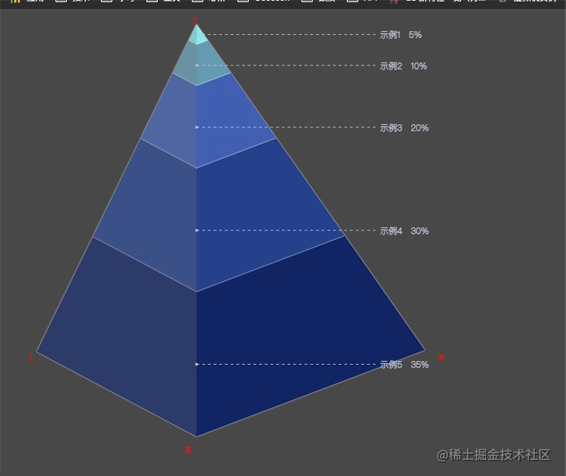
不多说先上效果

项目地址:(https://github.com/SHDjason/Pyramid.git)
正文
目前demo是基于vue2.x框架
项目实现可传入配置有:主体图位置(distance)、主体图偏移度(offset)、数据排序(sort)、图颜色(color)、数据文本回调(fontFormatter)、tooltip配置(tooltip)、数据展示样式配置(infoStyle)等

初始化canvas基本信息 并实现大小自适应
先创建 canvas画布
      // 创建canvas元素
      this.canvas = document.createElement('canvas')
      // 把canvas元素节点添加在el元素下
      el.appendChild(this.canvas)
      this.canvasWidth = el.offsetWidth
      this.canvasHeight = el.offsetHeight
      // 将canvas元素设置与父元素同宽
      this.canvas.setAttribute('width', this.canvasWidth)
      // 将canvas元素设置与父元素同高
      this.canvas.setAttribute('height', this.canvasHeight)
获取画布中心点 方便后面做自适应和定点
 this.canvasCenter = [
        Math.round((this.canvasWidth - this.integration.distance[0] * 2) / 2) + this.integration.distance[0],
        Math.round((this.canvasHeight - this.integration.distance[1] * 2) / 2) + this.integration.distance[1]
      ]
监听传来的数据 并计算数据占比
刚好在这编写 数据排序(sort)的传入配置
  watch: {
    data: {
      immediate: true,
      deep: true,
      handler(newValue) {
        // 数据总量
        let totalData = 0
        newValue.forEach(element => {
          totalData = totalData + Number(element.value)
        })
        this.dataInfo = newValue.map(item => {
          const accounted = (item.value / totalData) * 100
          return { ...item, accounted, title: this.integration.title }
        })
        if (this.integration.sort === 'max') {
          this.dataInfo.sort((a, b) => {
            return a.value - b.value
          })
        } else if (this.integration.sort === 'min') {
          this.dataInfo.sort((a, b) => {
            return b.value - a.value
          })
        }
      }
    }
  },
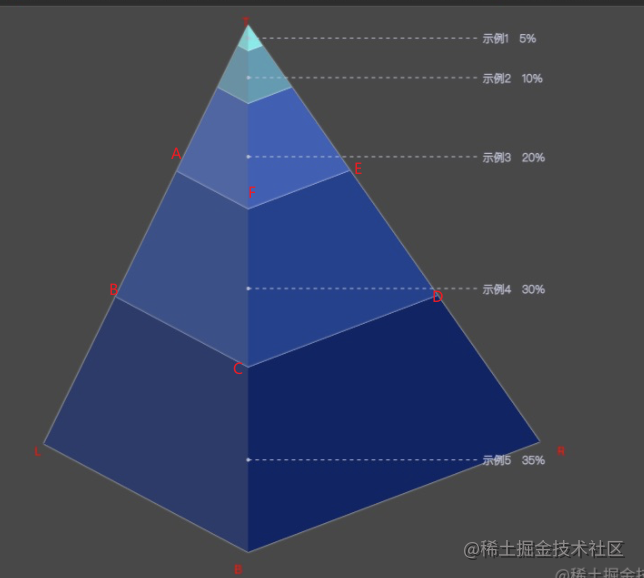
下面可以确定金字塔4个基本点的位置了
这几个基本点的位置决定在后面金字塔展示的形状 可以根据自己的审美进行微调
 if (this.canvas.getContext) {
        this.ctx = this.canvas.getContext('2d')
        // 金字塔基本点位置
        this.point.top = [this.canvasCenter[0] - this.canvasWidth / 13, this.integration.distance[1]]
        this.point.left = [
          this.integration.distance[0] * 1.5,
          this.canvasHeight - this.integration.distance[1] - this.canvasHeight / 5
        ]
        this.point.right = [
          this.canvasWidth - this.integration.distance[0] * 1.9,
          this.canvasHeight - this.integration.distance[1] - this.canvasHeight / 5
        ]
        this.point.bottom = [
          this.canvasCenter[0] - this.canvasWidth / 13,
          this.canvasHeight - this.integration.distance[1]
        ]
        this.point.shadow = [
          this.integration.distance[0] - this.canvasCenter[0] / 5,
          this.canvasHeight / 1.2 - this.integration.distance[1]
        ]
        for (const key in this.point) {
          this.point[key][0] = this.point[key][0] + this.integration.offset[0]
          this.point[key][1] = this.point[key][1] + this.integration.offset[1]
        }
      } else {
        throw 'canvas下未找到 getContext方法'
      }
完整代码
      let el = document.getElementById('canvas-warpper')
      // 创建canvas元素
      this.canvas = document.createElement('canvas')
      // 把canvas元素节点添加在el元素下
      el.appendChild(this.canvas)
      this.canvasWidth = el.offsetWidth
      this.canvasHeight = el.offsetHeight
      // 将canvas元素设置与父元素同宽
      this.canvas.setAttribute('width', this.canvasWidth)
      // 将canvas元素设置与父元素同高
      this.canvas.setAttribute('height', this.canvasHeight)
      this.canvasCenter = [
        Math.round((this.canvasWidth - this.integration.distance[0] * 2) / 2) + this.integration.distance[0],
        Math.round((this.canvasHeight - this.integration.distance[1] * 2) / 2) + this.integration.distance[1]
      ]
      if (this.canvas.getContext) {
        this.ctx = this.canvas.getContext('2d')
        // 金字塔基本点位置
        this.point.top = [this.canvasCenter[0] - this.canvasWidth / 13, this.integration.distance[1]]
        this.point.left = [
          this.integration.distance[0] * 1.5,
          this.canvasHeight - this.integration.distance[1] - this.canvasHeight / 5
        ]
        this.point.right = [
          this.canvasWidth - this.integration.distance[0] * 1.9,
          this.canvasHeight - this.integration.distance[1] - this.canvasHeight / 5
        ]
        this.point.bottom = [
          this.canvasCenter[0] - this.canvasWidth / 13,
          this.canvasHeight - this.integration.distance[1]
        ]
        this.point.shadow = [
          this.integration.distance[0] - this.canvasCenter[0] / 5,
          this.canvasHeight / 1.2 - this.integration.distance[1]
        ]
        for (const key in this.point) {
          this.point[key][0] = this.point[key][0] + this.integration.offset[0]
          this.point[key][1] = this.point[key][1] + this.integration.offset[1]
        }
      } else {
        throw 'canvas下未找到 getContext方法'
      }
      this.topAngle.LTB = this.angle(this.point.top, this.point.left, this.point.bottom)
      this.topAngle.RTB = this.angle(this.point.top, this.point.right, this.point.bottom)
      // 计算各数据点位置
      this.calculationPointPosition(this.dataInfo)
    },
计算金字塔每条边的角度
为了后面给每个数据定点 但是 唉~ 奈何数学太差 所以我就想到了一个方法 :
每条数据的定点范围肯定都是在 四个基本点的连线上。那我把每个基本点连线的角度求出来 ,到时候 在进行角度翻转到垂直后 再求每个条数据所占当前基本点连线的占比不就行了?
 /**
   * @description: 求3点之间角度
   * @return {*} 点 a 的角度
   * @author: 舒冬冬
   */
  angle(a, b, c) {
      const A = { X: a[0], Y: a[1] }
      const B = { X: b[0], Y: b[1] }
      const C = { X: c[0], Y: c[1] }
      const AB = Math.sqrt(Math.pow(A.X - B.X, 2) + Math.pow(A.Y - B.Y, 2))
      const AC = Math.sqrt(Math.pow(A.X - C.X, 2) + Math.pow(A.Y - C.Y, 2))
      const BC = Math.sqrt(Math.pow(B.X - C.X, 2) + Math.pow(B.Y - C.Y, 2))
      const cosA = (Math.pow(AB, 2) + Math.pow(AC, 2) - Math.pow(BC, 2)) / (2 * AB * AC)
      const angleA = Math.round((Math.acos(cosA) * 180) / Math.PI)
      return angleA
    }
计算各个数据点的位置
接下来就是确定每条数据的 绘画范围了
我们先把金字塔左边和有右边旋转垂直后的点的位置确定下来
/**
     * @description: 根据A点旋转指定角度后B点的坐标位置
     * @param {*} ptSrc 圆上某点(初始点);
     * @param {*} ptRotationCenter 圆心点
     * @param {*} angle 旋转角度°  -- [angle * M_PI / 180]:将角度换算为弧度
     * 【注意】angle 逆时针为正,顺时针为负
     * @return {*}
     * @author: 舒冬冬
     */
    rotatePoint(ptSrc, ptRotationCenter, angle) {
      const a = ptRotationCenter[0]
      const b = ptRotationCenter[1]
      const x0 = ptSrc[0]
      const y0 = ptSrc[1]
      const rx = a + (x0 - a) * Math.cos((angle * Math.PI) / 180) - (y0 - b) * Math.sin((angle * Math.PI) / 180)
      const ry = b + (x0 - a) * Math.sin((angle * Math.PI) / 180) + (y0 - b) * Math.cos((angle * Math.PI) / 180)
      const point = [rx, ry]
      return point
    },
const LP = this.rotatePoint(this.point.left, this.point.top, this.topAngle.LTB * -1)
      const RP = this.rotatePoint(this.point.right, this.point.top, this.topAngle.RTB)
LP 为 TL 的边 逆时针旋转 LTB 角度后的 点的位置
RP 为 TR 的边 顺时针旋转 RTB 角度后的 点的位置
这样就可以确定 每个数据点在 三条边上的各自所占长度了 完整代码
每个点的长度计算思路, 以在TL边上点为例:
拿到 LP (逆时针旋转 LTB角度后的位置)长度,根据数据所占总数据占比 求出该条数据的长度 再把角度转回去还原该边 就能拿到该条数据再 TL 边的上的位置信息。
const vertical = [ this.point.top[0], (LP[1] - this.point.top[1]) * (item.accounted / 100) + this.point.top[1] ]
  /**
    * @description: 计算数据的点位置
    * @param {*} val 点占比
    * @return {*}
    * @author: 舒冬冬
    */
   calculationPointPosition(val) {
     const LP = this.rotatePoint(this.point.left, this.point.top, this.topAngle.LTB * -1)
     const RP = this.rotatePoint(this.point.right, this.point.top, this.topAngle.RTB)
     let temporary = {
       left: [
         [0, 0],
         [0, 0],
         [0, 0]
       ],
       right: [
         [0, 0],
         [0, 0],
         [0, 0]
       ],
       middle: [
         [0, 0],
         [0, 0],
         [0, 0]
       ]
     }


     const dataInfo = val.map((item, index) => {
       if (index === 0) {
         for (const key in temporary) {
           if (key === 'left') {
             // 垂直后点的位置
             // 垂直后点点距离
             const vertical = [
               this.point.top[0],
               (LP[1] - this.point.top[1]) * (item.accounted / 100) + this.point.top[1]
             ]
             // 还原后点的位置
             temporary.left = [this.point.top, this.rotatePoint(vertical, this.point.top, this.topAngle.LTB), vertical]
           } else if (key === 'right') {
             // 垂直后点点距离
             const vertical = [
               this.point.top[0],
               (RP[1] - this.point.top[1]) * (item.accounted / 100) + this.point.top[1]
             ]
             // 还原后点的位置
             temporary.right = [
               this.point.top,
               this.rotatePoint(vertical, this.point.top, this.topAngle.RTB * -1),
               vertical
             ]
           } else if (key === 'middle') {
             // 垂直后点点距离
             temporary.middle = [
               this.point.top,
               [
                 this.point.top[0],
                 (this.point.bottom[1] - this.point.top[1]) * (item.accounted / 100) + this.point.top[1]
               ],
               [
                 this.point.top[0],
                 (this.point.bottom[1] - this.point.top[1]) * (item.accounted / 100) + this.point.top[1]
               ]
             ]
           }
         }
       } else {
         for (const key in temporary) {
           const vertical = JSON.parse(JSON.stringify(temporary[key][2]))
           if (key === 'left') {
             // 垂直后点点距离
             const vertical1 = [this.point.top[0], vertical[1] + (LP[1] - this.point.top[1]) * (item.accounted / 100)]
             // 还原后点的位置
             temporary.left = [
               this.point.top,
               this.rotatePoint(vertical1, this.point.top, this.topAngle.LTB),
               vertical1
             ]
           } else if (key === 'right') {
             // 垂直后点点距离
             const vertical1 = [this.point.top[0], vertical[1] + (RP[1] - this.point.top[1]) * (item.accounted / 100)]
             // 还原后点的位置
             temporary.right = [
               this.point.top,
               this.rotatePoint(vertical1, this.point.top, this.topAngle.RTB * -1),
               vertical1
             ]
           } else if (key === 'middle') {
             temporary.middle = [
               this.point.top,
               [this.point.top[0], (this.point.bottom[1] - this.point.top[1]) * (item.accounted / 100) + vertical[1]],
               [this.point.top[0], (this.point.bottom[1] - this.point.top[1]) * (item.accounted / 100) + vertical[1]]
             ]
           }
         }
       }

       return { ...item, temporary: JSON.parse(JSON.stringify(temporary)) }
     })
     this.dataInfo = dataInfo
   },
这样就拿到了每个数据在每一条边上所占长度的点位。
绘画
数据图层绘画
我们虽然拿到了每个数据在每一条边上所占长度的点位。 那怎么获取这条数据在该边上的所在的线段长度呢? 很简单 因为 第一条数据的在该边长度的第二个点的位置就是第二条数据的第一个点的位置 现在就可以进行下一步。 数据 图层的绘画了
   /**
    * @description: 数据图层绘画
    * @param {*}
    * @return {*}
    * @author: 舒冬冬
    */
   paintDataInfo() {
     // let data = JSON.parse(JSON.stringify(this.dataInfo))
     // data.reverse()
     var index = -1
     this.dataInfo = this.dataInfo.map(item => {
       index++
       if (this.integration.color.length === index) {
         index = 0
       }
       return { ...item, color: this.integration.color[index] }
     })
     this.dataInfo = this.dataInfo.map((item, index) => {
       let drawingPoint = []
       this.ctx.fillStyle = item.color
       this.ctx.beginPath()
       let point1, point2, point3, point4, point5, point6
       if (index === 0) {
         [point1, point2, point3, point4, point5, point6] = [
           item.temporary.left[0],
           item.temporary.left[1],
           item.temporary.middle[1],
           item.temporary.right[1],
           item.temporary.right[0],
           item.temporary.middle[0]
         ]
       } else {
         [point1, point2, point3, point4, point5, point6] = [
           this.dataInfo[index - 1].temporary.left[1],
           item.temporary.left[1],
           item.temporary.middle[1],
           item.temporary.right[1],
           this.dataInfo[index - 1].temporary.right[1],
           this.dataInfo[index - 1].temporary.middle[1]
         ]
       }
       this.ctx.moveTo(...point1)
       this.ctx.lineTo(...point2)
       this.ctx.lineTo(...point3)
       this.ctx.lineTo(...point4)
       this.ctx.lineTo(...point5)
       this.ctx.lineTo(...point6)
       drawingPoint = [point1, point2, point3, point4, point5, point6]
       if (this.integration.infoStyle.stroke) {
         this.ctx.shadowOffsetX = 0
         this.ctx.shadowOffsetY = 0
         this.ctx.shadowBlur = 2
         this.ctx.shadowColor = this.integration.infoStyle.strokeColor
       }
       this.ctx.fill()
       return { ...item, drawingPoint }
     })
   }
以上就基本完成 金字塔图的核心内容了。
但是还是不够, 想要达到Echarts的简单的功能,单单有图是不行的
文字的绘画
字体绘画就比较简单了, 我们拥有每一个数据的点的位置,把每个数据点的 F C 两个点的长度 除2 的点的位置设为起点就行了
 /**
    * @description: 绘画字体
    * 此方法请在 paintDataInfo() 执行后使用
    * @param {*}
    * @return {*}
    * @author: 舒冬冬
    */
   paintingText(lData) {
     this.ctx.shadowColor = 'rgba(90,90,90,0)'
     const color = this.integration.infoStyle.color ? this.integration.infoStyle.color : '#fff'
     const width = this.integration.infoStyle.width ? this.integration.infoStyle.width : 0
     const dotSize = this.integration.infoStyle.dotSize ? this.integration.infoStyle.dotSize : 4
     const offset = this.integration.infoStyle.offset ? this.integration.infoStyle.offset : [0, 0]
     let text = ''
     this.ctx.strokeStyle = color
     this.ctx.fillStyle = color
     this.dataInfo.forEach((item, index) => {
       if (item.drawingPoint) {
         let line = [
           [0, 0],
           [0, 0]
         ]
         this.ctx.font = `normal lighter ${
           this.integration.infoStyle.size ? this.integration.infoStyle.size : 14
         }px sans-serif `

         this.ctx.beginPath()
         if (lData && index + 1 === lData.l) {
           line = [
             [
               lData.obj.drawingPoint[2][0],
               (lData.obj.drawingPoint[2][1] - lData.obj.drawingPoint[5][1]) / 2 + lData.obj.drawingPoint[5][1]
             ],
             [
               lData.obj.drawingPoint[2][0] + lData.obj.drawingPoint[2][0] / 2 + width,
               (lData.obj.drawingPoint[2][1] - lData.obj.drawingPoint[5][1]) / 2 + lData.obj.drawingPoint[5][1]
             ]
           ]

           this.ctx.font = `normal lighter ${
             this.integration.infoStyle.size ? this.integration.infoStyle.size + 2 : 16
           }px sans-serif `
           text =
             this.integration.fontFormatter(item) !== 'default'
               ? this.integration.fontFormatter(item)
               : lData.obj.value + ' ---- ' + lData.obj.name
           this.ctx.setLineDash([0, 0])
           this.ctx.strokeText(
             text,
             line[1][0] + offset[0],
             line[1][1] + (this.integration.infoStyle.size ? this.integration.infoStyle.size + 2 : 14) / 3 + offset[1]
           )
         } else {
           line = [
             [
               item.drawingPoint[2][0],
               (item.drawingPoint[2][1] - item.drawingPoint[5][1]) / 2 + item.drawingPoint[5][1]
             ],
             [
               item.drawingPoint[2][0] + item.drawingPoint[2][0] / 2 + width,
               (item.drawingPoint[2][1] - item.drawingPoint[5][1]) / 2 + item.drawingPoint[5][1]
             ]
           ]
           text =
             this.integration.fontFormatter(item) !== 'default'
               ? this.integration.fontFormatter(item)
               : item.value + ' ----- ' + item.name
           this.ctx.setLineDash([0, 0])
           this.ctx.strokeText(
             text,
             line[1][0] + offset[0],
             line[1][1] + (this.integration.infoStyle.size ? this.integration.infoStyle.size + 2 : 16) / 3 + offset[1]
           )
         }
         this.ctx.setLineDash(this.integration.infoStyle.setLineDash)
         this.ctx.moveTo(...line[0])
         this.ctx.lineTo(...line[1])
         this.ctx.stroke()
         this.ctx.arc(...line[0], dotSize, 0, 360, false)
         this.ctx.fill() //画实心圆
       } else {
         throw '未找到 drawingPoint 属性'
       }
     })
   },
高亮图层
高亮图层无非就是监听鼠标移入位置,并且判断鼠标移入位置是否存在图层内,在哪个图层内,然后重新绘画当前图层
  /**
    * @description: 鼠标事件注册
    * @param {*}
    * @return {*}
    * @author: 舒冬冬
    */
   eventRegistered() {
     const canvasWarpper = document.getElementById('canvas-warpper')
     //注册事件
     canvasWarpper.addEventListener('mousedown', this.doMouseDown, false)
     canvasWarpper.addEventListener('mouseup', this.doMouseUp, false)
     canvasWarpper.addEventListener('mousemove', this.doMouseMove, false)
     // //注册事件
     // this.canvas.addEventListener('mousedown', this.doMouseDown, false)
     // this.canvas.addEventListener('mouseup', this.doMouseUp, false)
     // this.canvas.addEventListener('mousemove', this.doMouseMove, false)
   },
      /**
    * @description: 鼠标移动
    * @param {*} e
    * @return {*}
    * @author: 舒冬冬
    */
   // eslint-disable-next-line no-unused-vars
   doMouseMove(e) {
     const x = e.pageX
     const y = e.pageY
     this.highlightCurrentRegion(this.determineDataMouse(this.getLocation(x, y)))
     if (this.integration.tooltip.show) {
       this.showTooltip(this.determineDataMouse(this.getLocation(x, y)), this.getLocation(x, y))
     }
   },
 /**
    * @description: 判断鼠标在哪层位置上
    * @param {*}
    * @return {*}
    * @author: 舒冬冬
    */
   determineDataMouse(mouseLocation) {
     let req = false
     for (let index = 0; index < this.dataInfo.length; index++) {
       if (this.insidePolygon(this.dataInfo[index].drawingPoint, mouseLocation)) {
         return (req = { l: index + 1, obj: this.dataInfo[index] })
       }
     }
     return req
   },
 /**
    * @description: 高亮某一层级
    * @param {*} lData 层级数据
    * @return {*}
    * @author: 舒冬冬
    */
   highlightCurrentRegion(lData) {
     // const width = this.canvas.width;
     // this.canvas.width = width;

     this.ctx.clearRect(0, 0, this.canvas.width, this.canvas.height)
     if (!lData) {
       this.paintDataInfo()
       this.ctx.shadowColor = 'rgba(90,90,90,0)'
       this.paintingBody()
       this.paintingText()
       return
     }
     this.paintDataInfo()
     this.ctx.shadowColor = 'rgba(90,90,90,0)'
     this.paintingBody()
     this.ctx.fillStyle = lData.obj.color
     //  this.ctx.scale(1.05, 1.05)
     this.ctx.beginPath()
     this.ctx.moveTo(lData.obj.drawingPoint[0][0], lData.obj.drawingPoint[0][1])
     this.ctx.lineTo(lData.obj.drawingPoint[1][0], lData.obj.drawingPoint[1][1])
     this.ctx.lineTo(lData.obj.drawingPoint[2][0], lData.obj.drawingPoint[2][1])
     this.ctx.lineTo(lData.obj.drawingPoint[3][0], lData.obj.drawingPoint[3][1])
     this.ctx.lineTo(lData.obj.drawingPoint[4][0], lData.obj.drawingPoint[4][1])
     this.ctx.lineTo(lData.obj.drawingPoint[5][0], lData.obj.drawingPoint[5][1])
     this.ctx.shadowOffsetX = 0
     this.ctx.shadowOffsetY = 0
     this.ctx.shadowBlur = 10
     this.ctx.shadowColor = this.integration.infoStyle.highlightedColor
     this.ctx.fill()
     // 阴影绘制
     this.ctx.beginPath()
     this.ctx.moveTo(lData.obj.drawingPoint[0][0], lData.obj.drawingPoint[0][1])
     this.ctx.lineTo(lData.obj.drawingPoint[1][0], lData.obj.drawingPoint[1][1])
     this.ctx.lineTo(lData.obj.drawingPoint[2][0], lData.obj.drawingPoint[2][1])
     this.ctx.lineTo(lData.obj.drawingPoint[5][0], lData.obj.drawingPoint[5][1])
     this.ctx.fillStyle = 'rgba(120,120,120,.15)'
     this.ctx.fill()
     this.paintingText(lData)
   }
显示tooltip位置
可以先定义 tooltip 的渲染模板

然后在代码上进行渲染
 showTooltip(lData, coordinates) {
     let canvasWarpper = document.getElementById('canvas-warpper')
     let canvasTooltip = document.getElementById('canvas-tooltip')
     if (lData) {
       canvasTooltip.style.zIndex = this.integration.tooltip.z
       canvasTooltip.style.transition =
         ' opacity 0.2s cubic-bezier(0.23, 1, 0.32, 1) 0s, visibility 0.2s cubic-bezier(0.23, 1, 0.32, 1) 0s,transform 0.15s'
       let html = JSON.parse(JSON.stringify(this.tooltipDiv))
       if (this.integration.tooltip.formatter) {
         html = this.integration.tooltip.formatter(lData)
       } else {
         const searchVal = [
           ['$[title]$', lData.obj.title],
           ['$[name]$', lData.obj.name],
           ['$[val]$', lData.obj.value],
           ['$[color]$', lData.obj.color],
           ['$[fontSize]$', this.integration.tooltip.fontSize],
           ['$[backgroundColor]$', this.integration.tooltip.backgroundColor],
           ['$[fontColor]$', this.integration.tooltip.fontColor]
         ]
         searchVal.forEach(el => {
           html = html.replaceAll(...el)
         })
       }
       canvasTooltip.innerHTML = html
       canvasWarpper.style.cursor = 'pointer'
       canvasTooltip.style.visibility = 'visible'
       canvasTooltip.style.opacity = 1
       let [x, y] = coordinates
       x = x + 20
       y = y + 20
       // 画布高度
       // canvasHeight: 0,
       // 画布宽度
       // canvasWidth: 0,
       // 判断是否超出框架内容
       if (x + canvasTooltip.clientWidth > this.canvasWidth) {
         x = x - canvasTooltip.clientWidth - 40
       }
       if (y + canvasTooltip.clientHeight > this.canvasHeight) {
         y = y - canvasTooltip.clientHeight - 40
       }
       canvasTooltip.style.transform = `translate3d(${x}px, ${y}px, 0px)`
     } else {
       canvasWarpper.style.cursor = 'default'
       canvasTooltip.style.visibility = 'hidden'
       canvasTooltip.style.opacity = 0
     }
   },
而一些其他的配置功能呢也是比较简单的操作了,主要是太懒了😂, 直接上完整源码吧! 源码上注释也比较全,不是很清楚的可以评论,我看到会回复的!
完整源码
结尾
项目地址:(https://github.com/SHDjason/Pyramid.git)
到此这篇关于使用canvas仿Echarts实现金字塔图的实例代码的文章就介绍到这了,更多相关canvas仿Echarts金字塔图内容请搜索仿站网www.ecmsw.cn以前的文章或继续浏览下面的相关文章,希望大家以后多多支持仿站网www.ecmsw.cn!